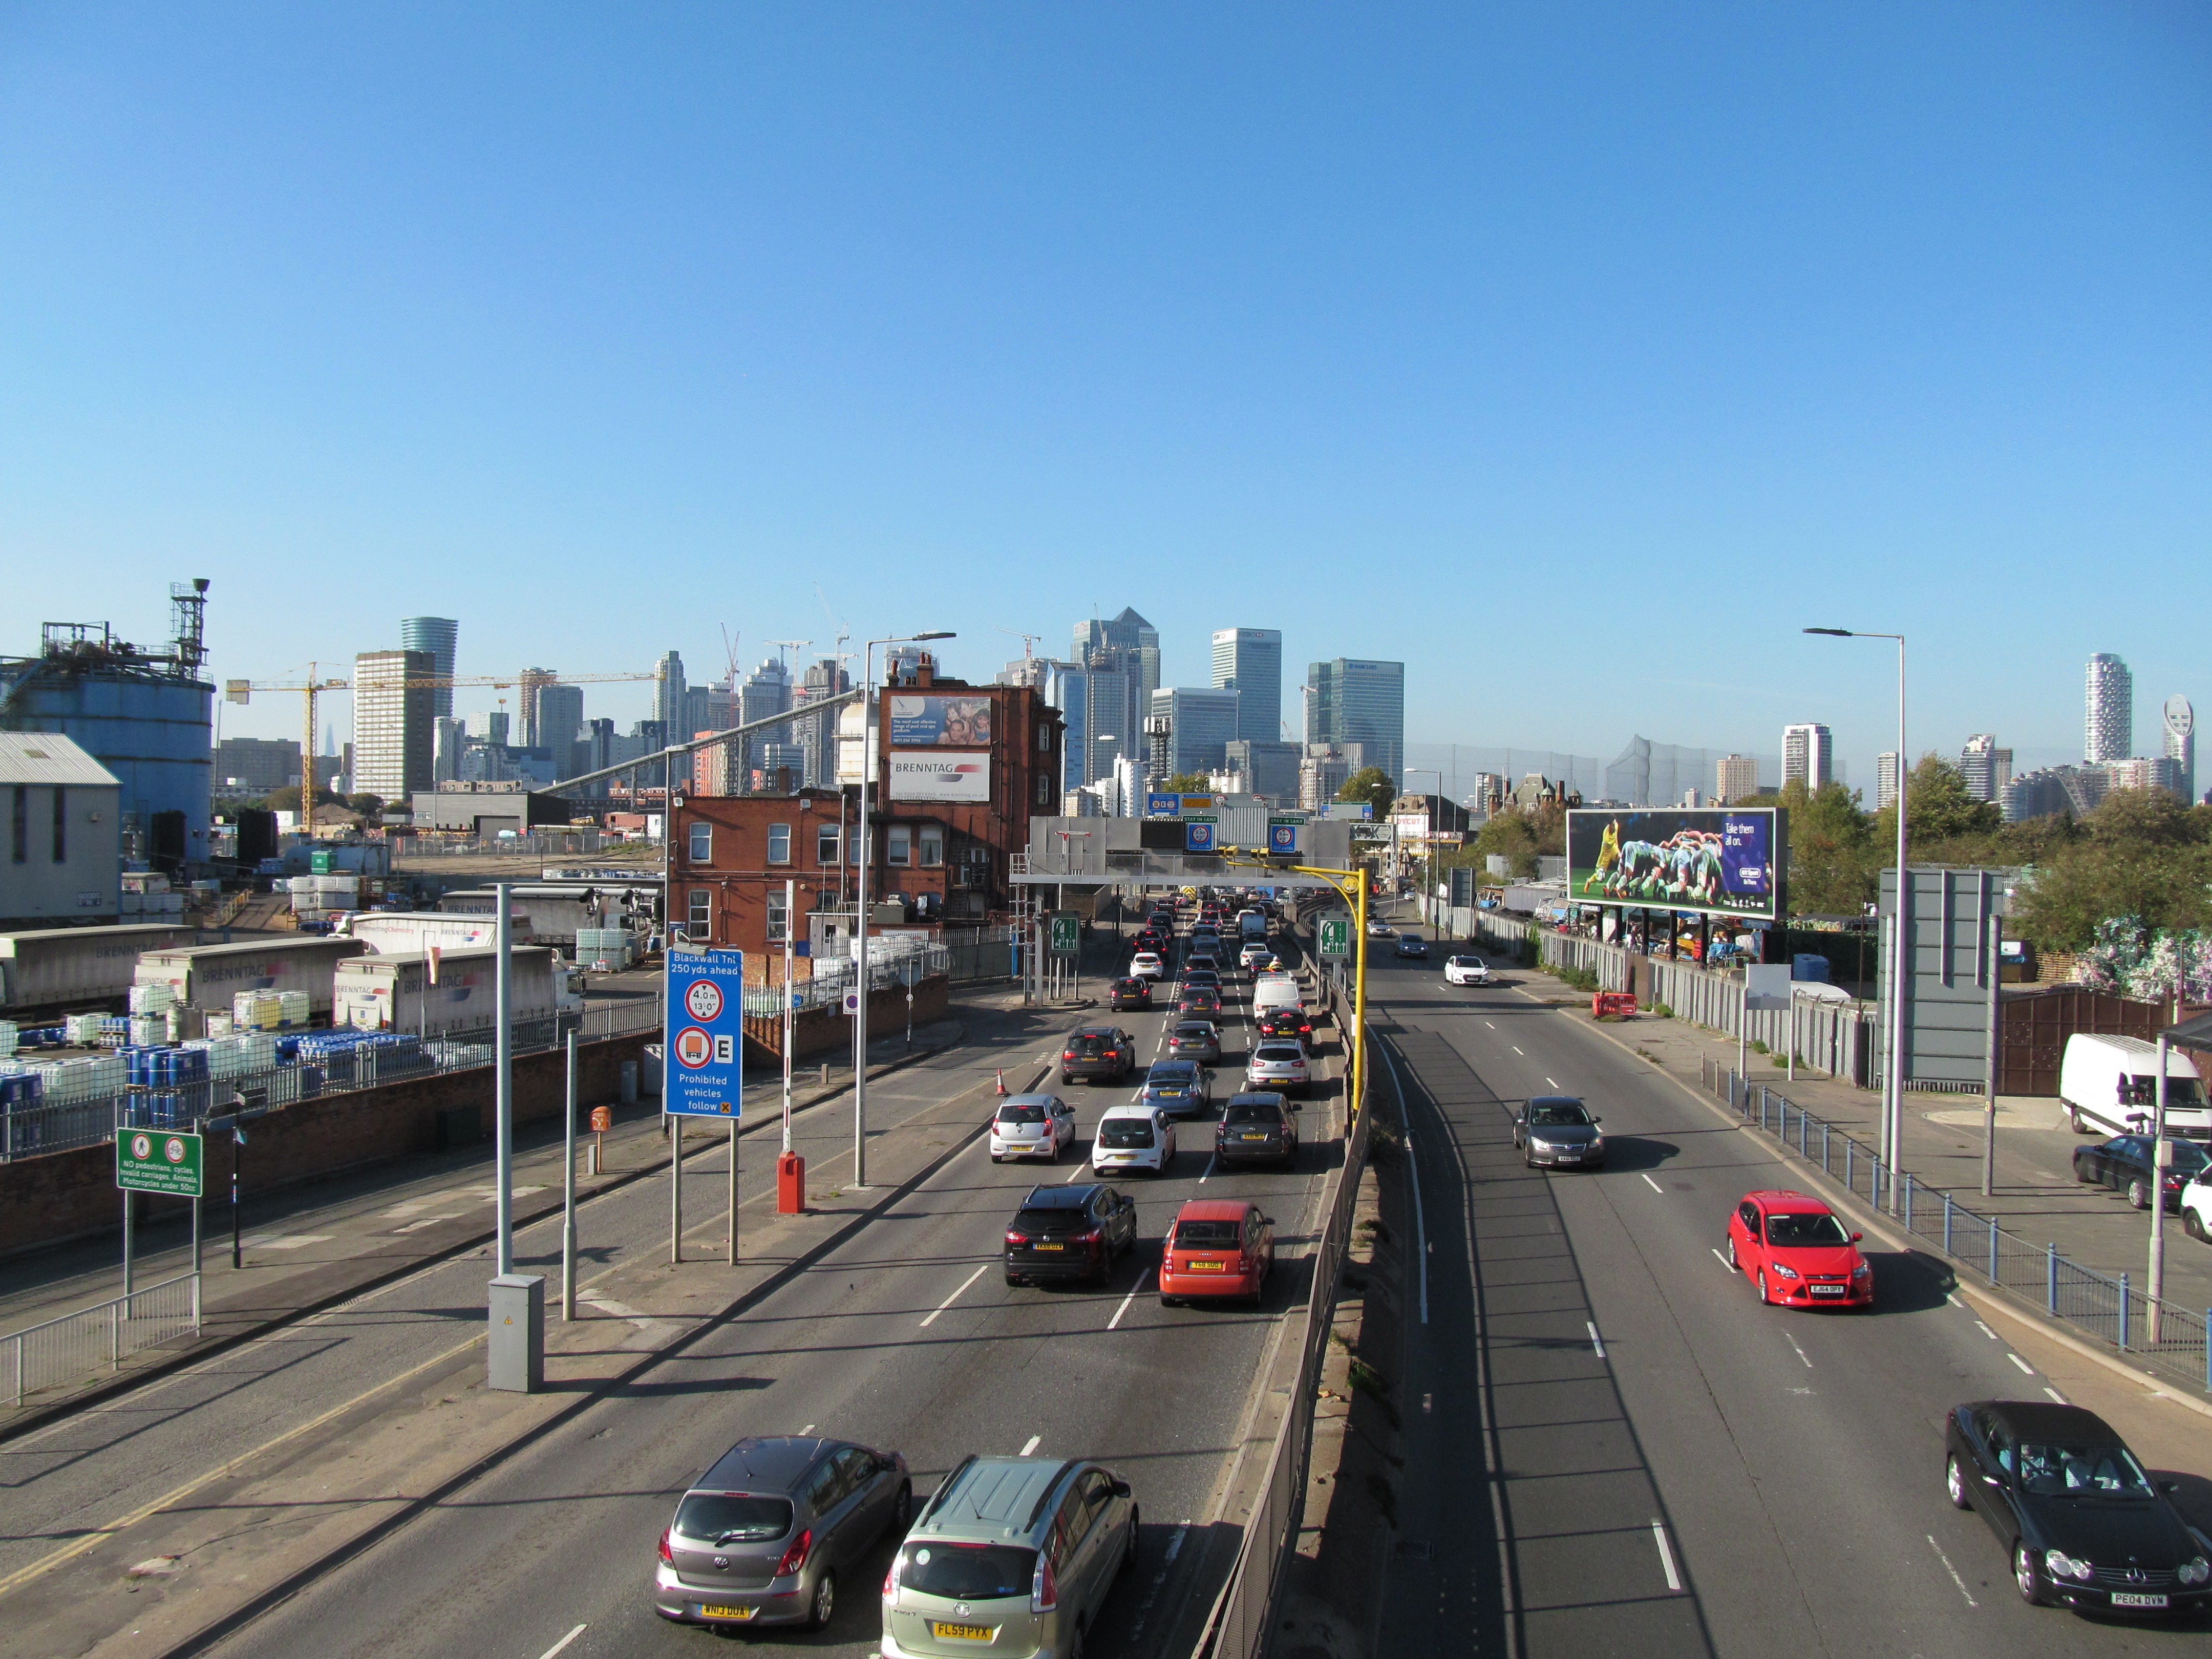
Greenwich saw 1,500 new homes last year – near top in London
Newly released figures for new housing construction across the UK show Greenwich borough add 1,459 units added last year, with an accompanying income of £3,707,012 set to be received from government due in 2022/23.
Income is from the New Homes Bonus scheme created by central Government back in 2011, who set the rate of payment to councils based on homes, council tax bands and the number of those deemed affordable.

Greenwich are regularly near the top for new housing and related New Homes Bonus income dating back over the past decade, though when it comes to funding received via another fund where council’s have much more say and input – the Community Infrastructure Levy – Greenwich are near bottom in London over the same time period.
New Homes Bonus payments include extra if homes are “affordable” which has hit Greenwich’s total this year. Just 247 out of 1459 total homes met that definition.
Borough totals
While Greenwich saw 1,459 new homes from October 2020 to October 2021, here’s other borough totals:
Southwark: 1,355
Lewisham: 300
Bexley: 636
Lambeth: 1,302
Brent: 1,956
Hackney: 1,144
Redbridge: 662
I’m not going to list every single borough, though you can check here.
All those boroughs saw higher CIL income – in many cases substantially so despite fewer homes built.
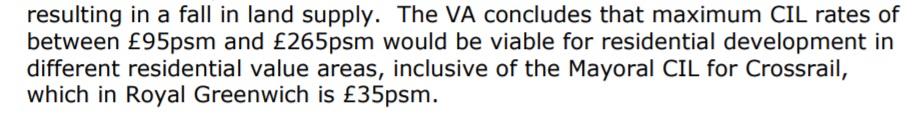
This failure to capture income in Greenwich borough falls firmly on the authority’s lap. They adopted a very low levy for developers to pay back in 2015. They could have gone up to a level of charging developers £230 per square metre for residential development in much of the borough due to a viability report when CIL was established – but chose £70 psm. That has caused a large shortfall for seven years and counting.
Year after year the borough sits near top for new homes and near bottom for CIL revenue.
They now like to portray this as being beyond their control – though the a key 2015 report from the Planning Examiner states “The Council is proposing to charge a single rate of £70psm” which included areas of high land values such as Greenwich town centre. An extremely low rate for such an area.
Here’s the section showing they could have gone for a higher rate in parts of the borough:
They then failed to alter rates in 2018 despite other London councils increasing their CIL levy and that same 2015 report committing to a review.
Rather than increasing CIL rates, the Mayor reduced the GLA levy for Greenwich from £35psm to £25psm offering Greenwich scope to increase. It hasn’t been taken. In fact, a council documents just this week still incorrectly states what zone Greenwich are in despite it being over three years since changes were announced.
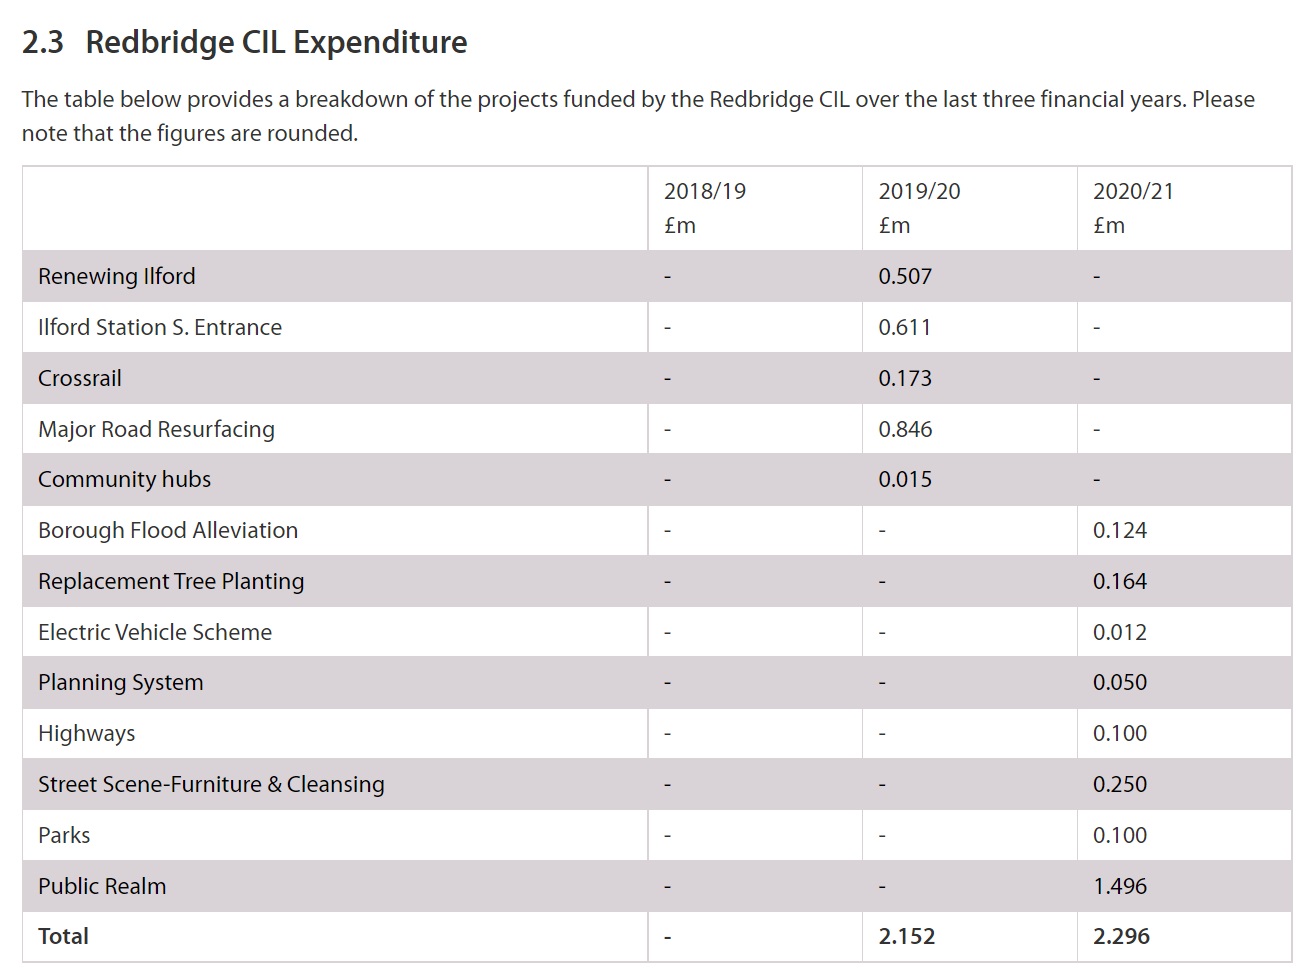
The council’s Planning Department already appear to have conceded they made mistakes by allocating two additional staff members to look into income they may not have collected, yet that only happened in 2021 – a full six years after CIL was adopted and by which time income was far below 2015 estimates (£9.7m v £27.5m estimated).
Some Greenwich Labour councillors have attempted to deny there’s any issue claiming reports of funding issues were “misleading”, despite the shortfall impacting services borough-wide.
When questioned by residents some councillors state Greenwich cannot be compared to central London boroughs. Which is true, yet they also fall far behind many non-Zone 1 boroughs. The so-called donut of boroughs that surrounds Zone 1 yet isn’t in the outer London Conservative-strongholds of Bromley, Bexley and Havering to name but three. That Labour inner doughnut comfortably outpaces Greenwich for revenue. Places like Newham, Haringey and Brent. Even many outer-London Tory boroughs have gained more income for their residents.
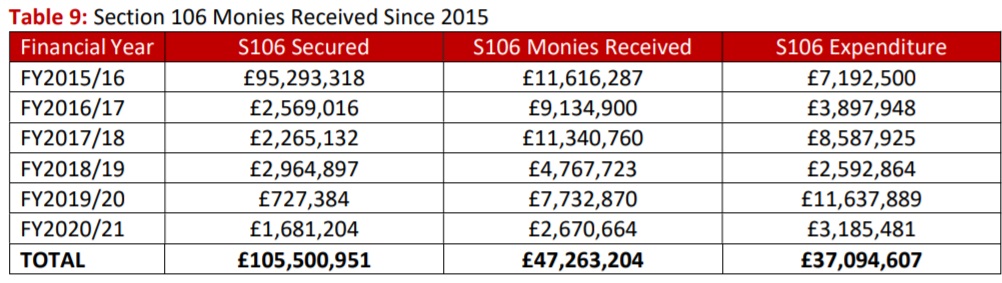
There’s also the argument that some masterplans pre-date CIL (in part as Greenwich were quite slow to adopt it). They are liable for Section 106 entirely rather than both, yet even S106 income has dropped off massively in the past three years without CIL making up the difference.
Transparency?
One revealing snippet in all this is a lack of transparency from Greenwich’s Planning Department. Alone in London, they do not reveal Demand Notices for payment issued to developers in their annual report.
It’s a standard detail included in every other authority’s annual report. It lays out what has been requested and offers a guide to forthcoming income.

Every other borough’s CIL report includes information on notices sent out to developer alongside where and how it’s spent.
The main beneficiary are developers who’ve paid and continue to pay such a low rate which could – and should – have benefitted local residents.
A small amount of overall income has benefitted areas through the Greenwich Neighbourhood Fund, but even then it should be so much greater and is set by law at 15 per cent of overall income. 15 per cent of just £1m last year is a hell of a lot less than 15 per cent of £15m-£20m seen in other parts of the capital that apply a higher levy.
Running a site alone takes time and a fair bit of money. Adverts are far from enough to cover it and my living costs as a private renter.
You can support me including via Paypal here Another option is via Patreon by clicking here You can also buy me a beer/coffee at Ko-fi here There's also a Facebook page for the site here Many thanks