A look at Crossrail’s station usage numbers in the first month
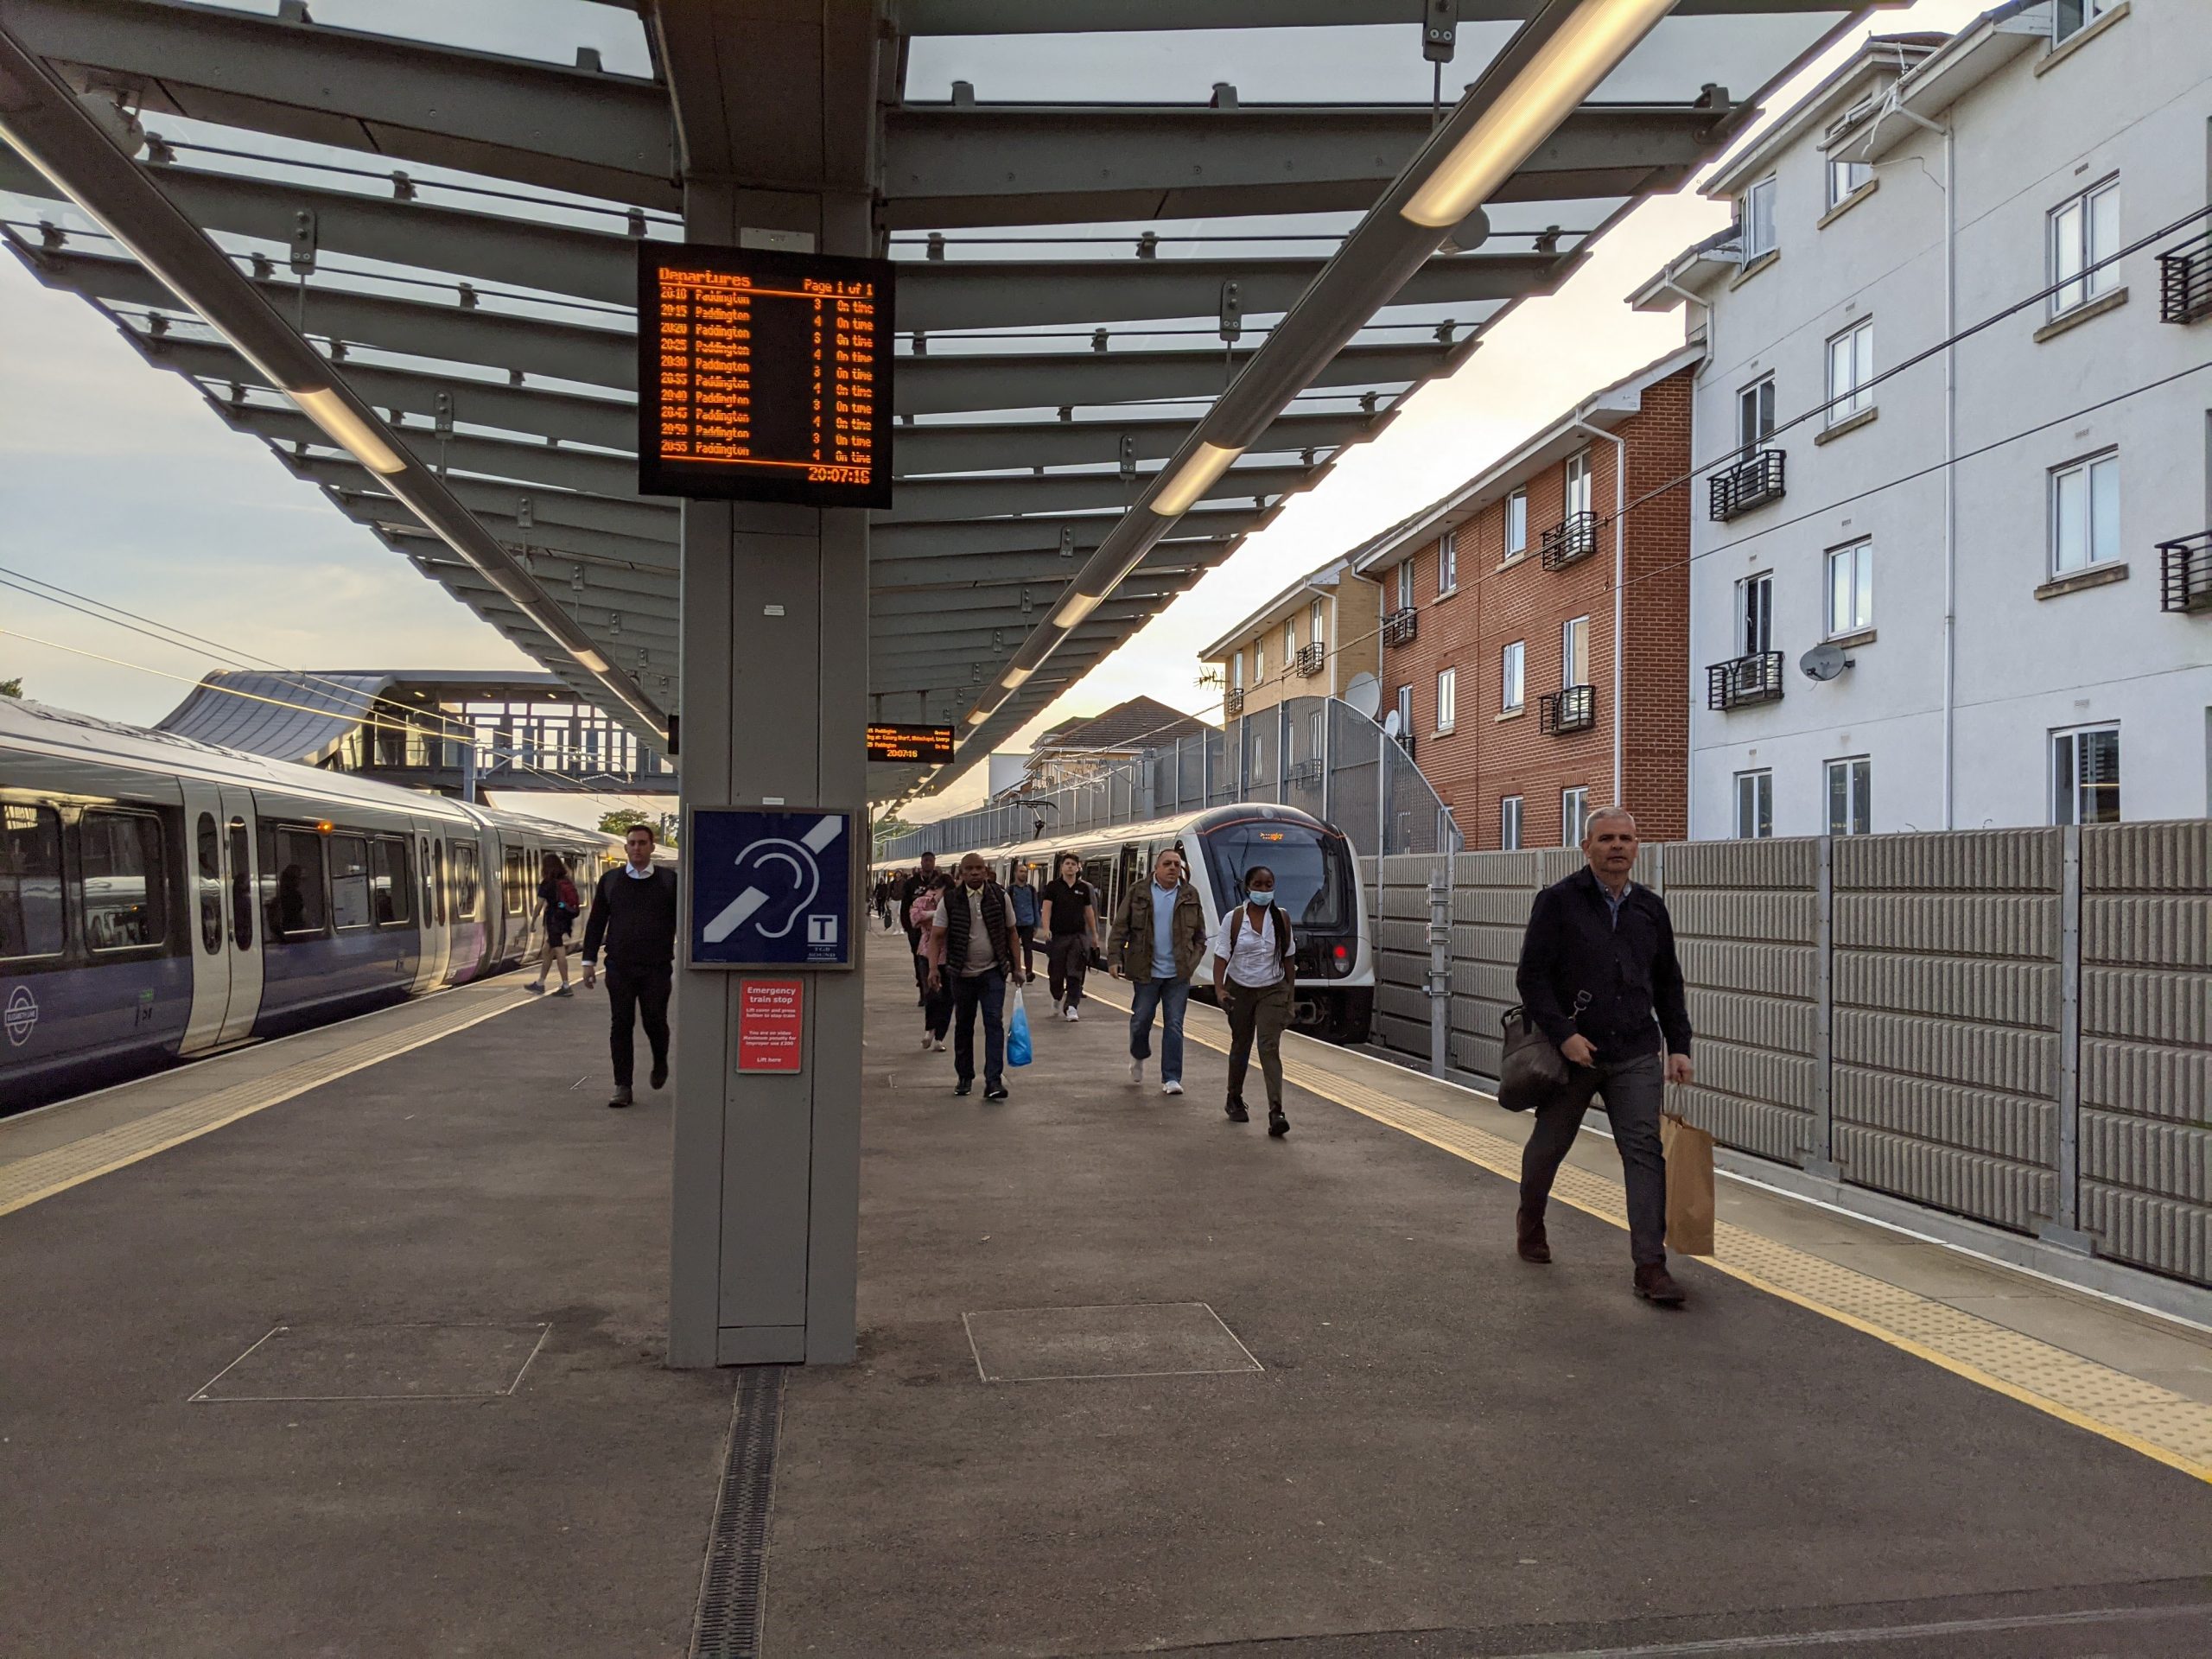
A full list of passenger journeys at stations across the Elizabeth line has been revealed by Transport for London after the line opened on 24th May.
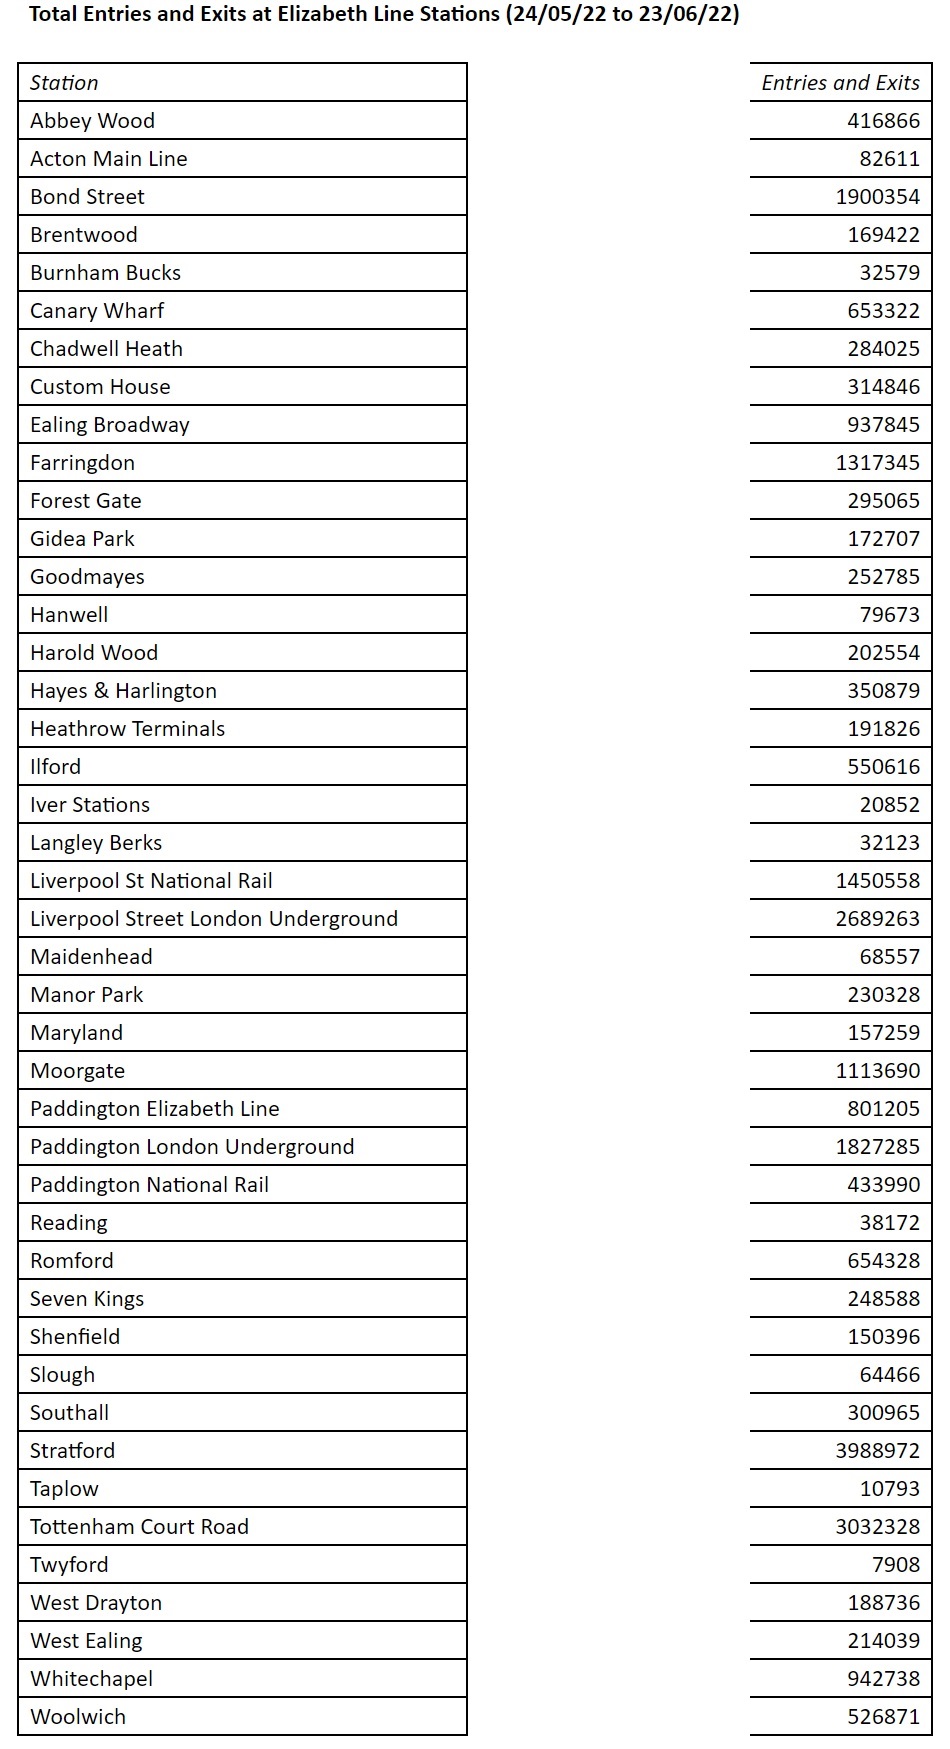
A Freedom of Information request has shown usage up to 23rd June across the line, with figures for both existing sections and the new core area from Abbey Wood to Paddington.
Now of course there’s a huge number of caveats to consider. For one it includes Bond Street and the station hasn’t even opened yet.
Many other stations also serve one than one line or mode of transport. For example Custom House was solely a DLR station and now has the Elizabeth line and those in central London can link to numerous modes of transport beyond the gateline.
However it’s still fun to dive into the figures and and indulge in a spot of speculation. For one, Woolwich at 526,871 seems impressive compared to Canary Wharf at 653,332. Both are self-contained.
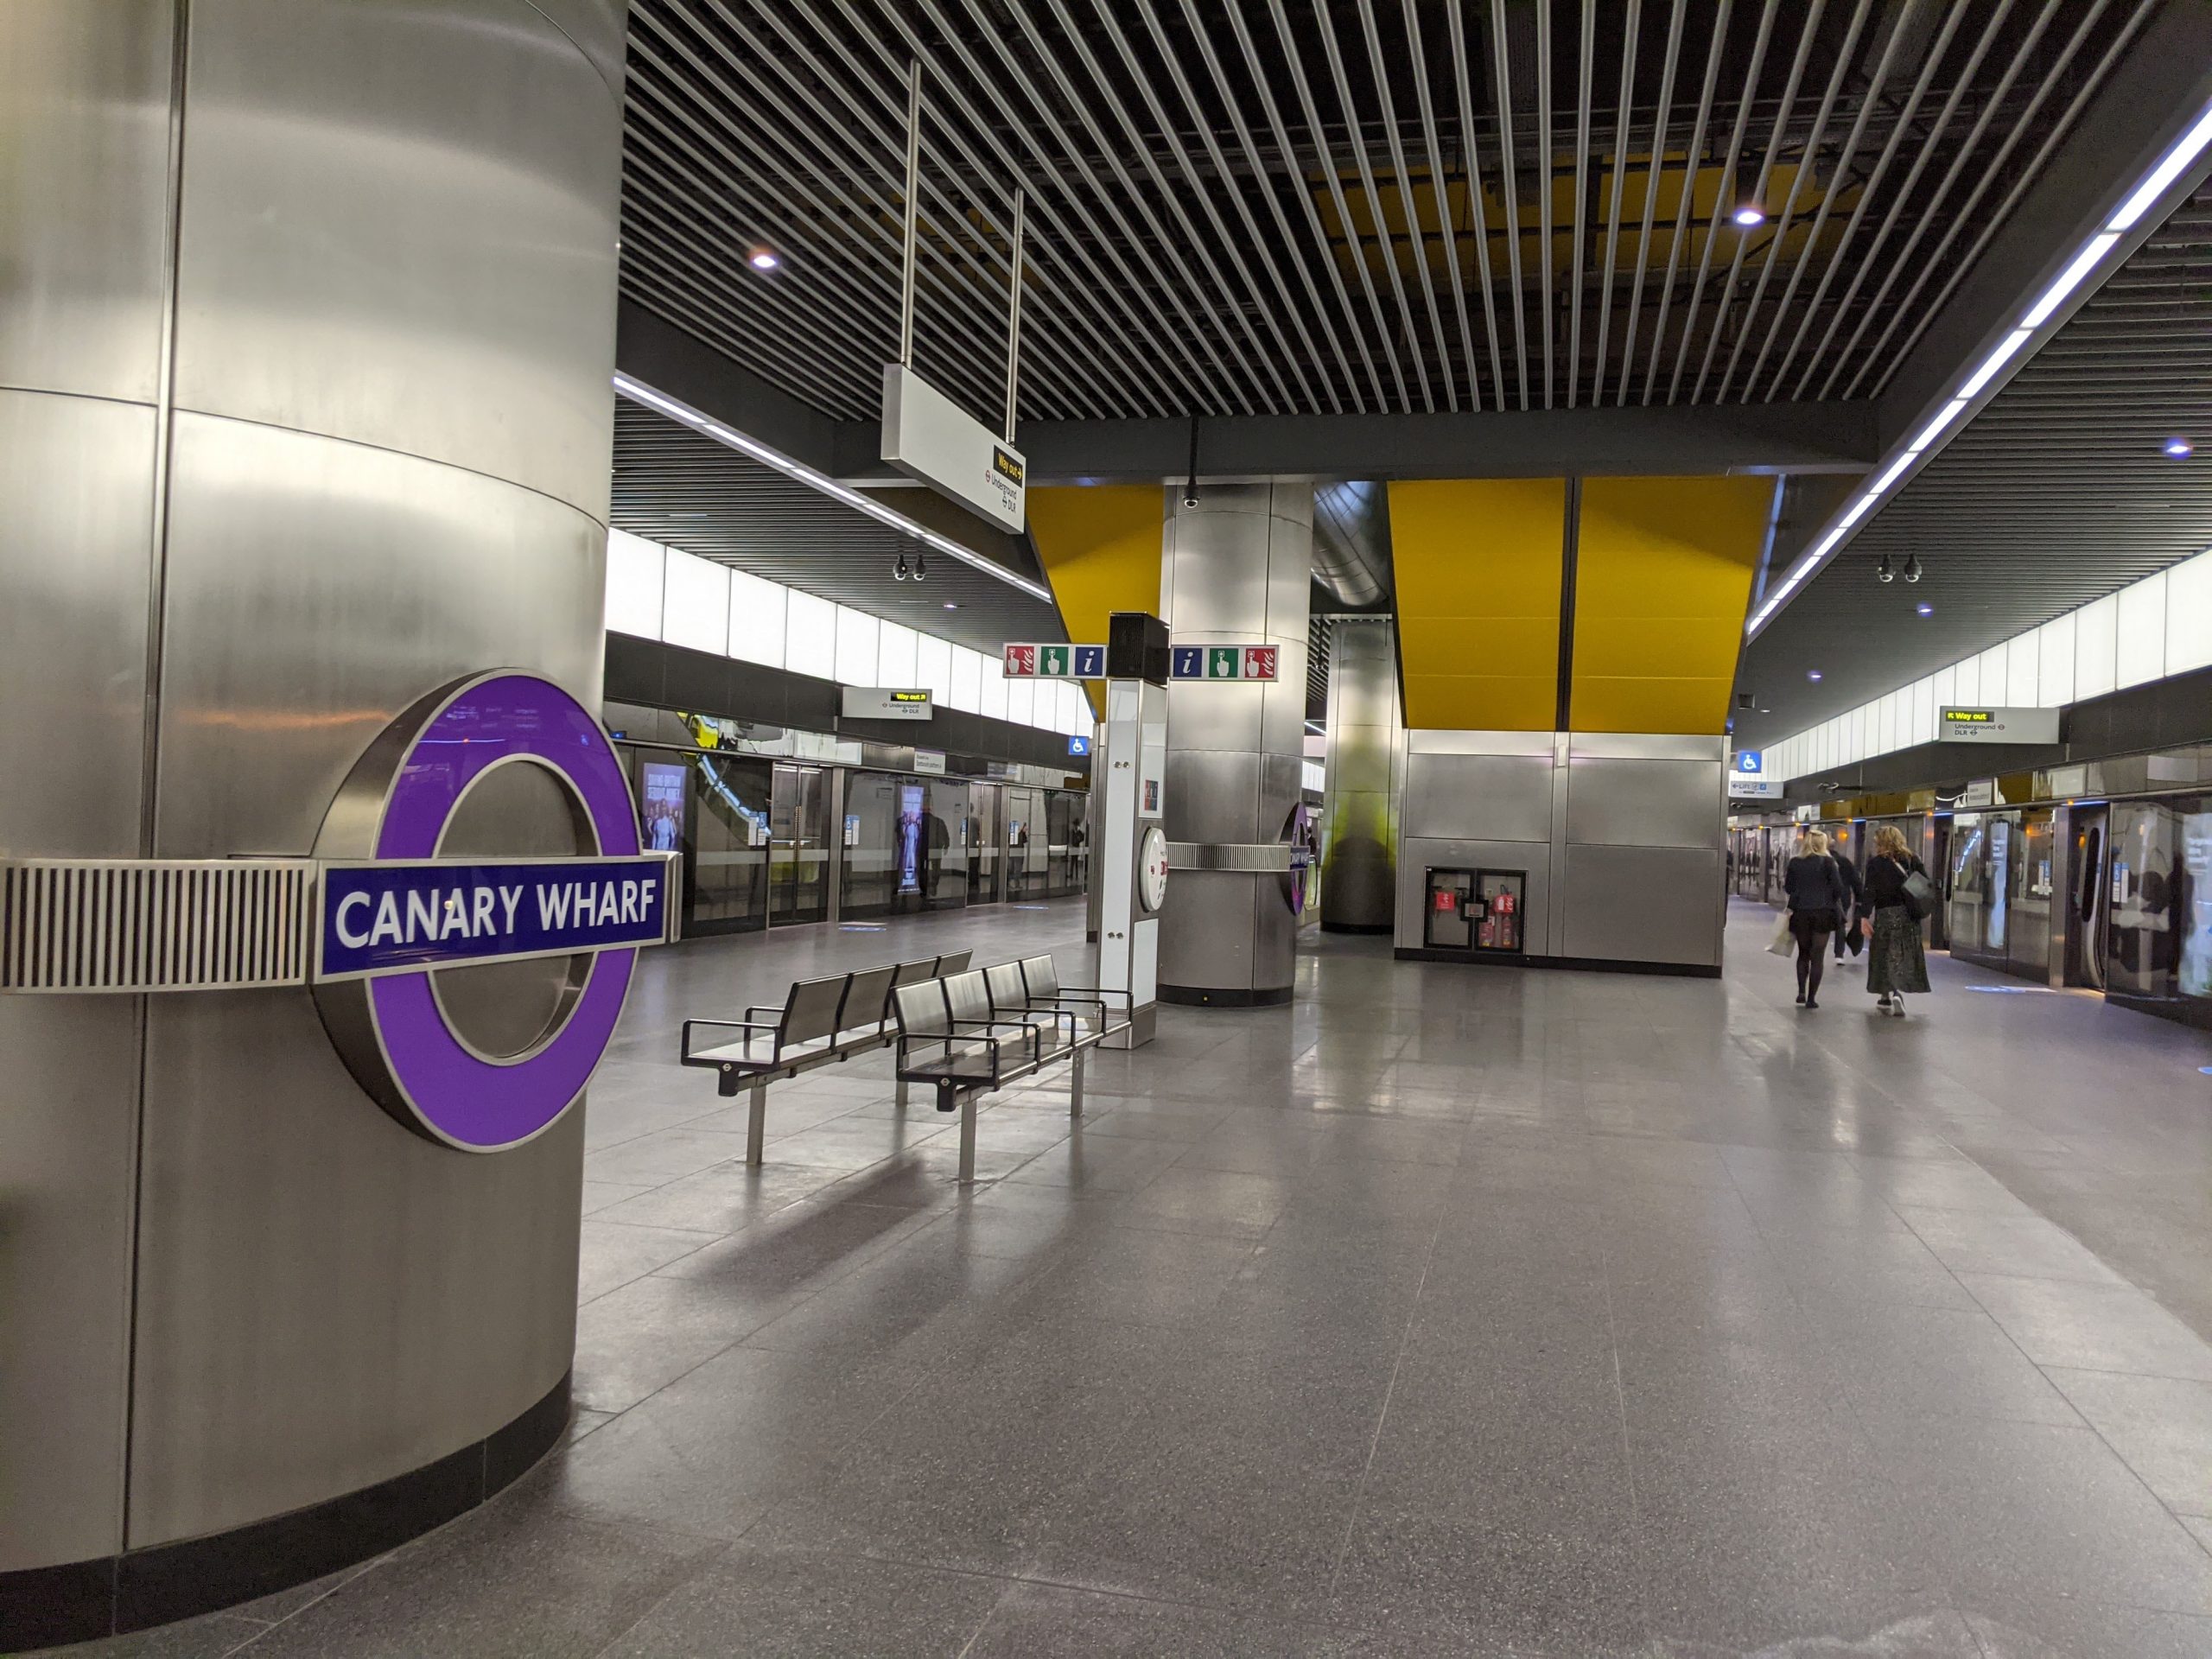
Commuting to Canary Wharf has dropped somewhat compared to pre-pandemic, but there’s not much in usage between the two which may surprise.
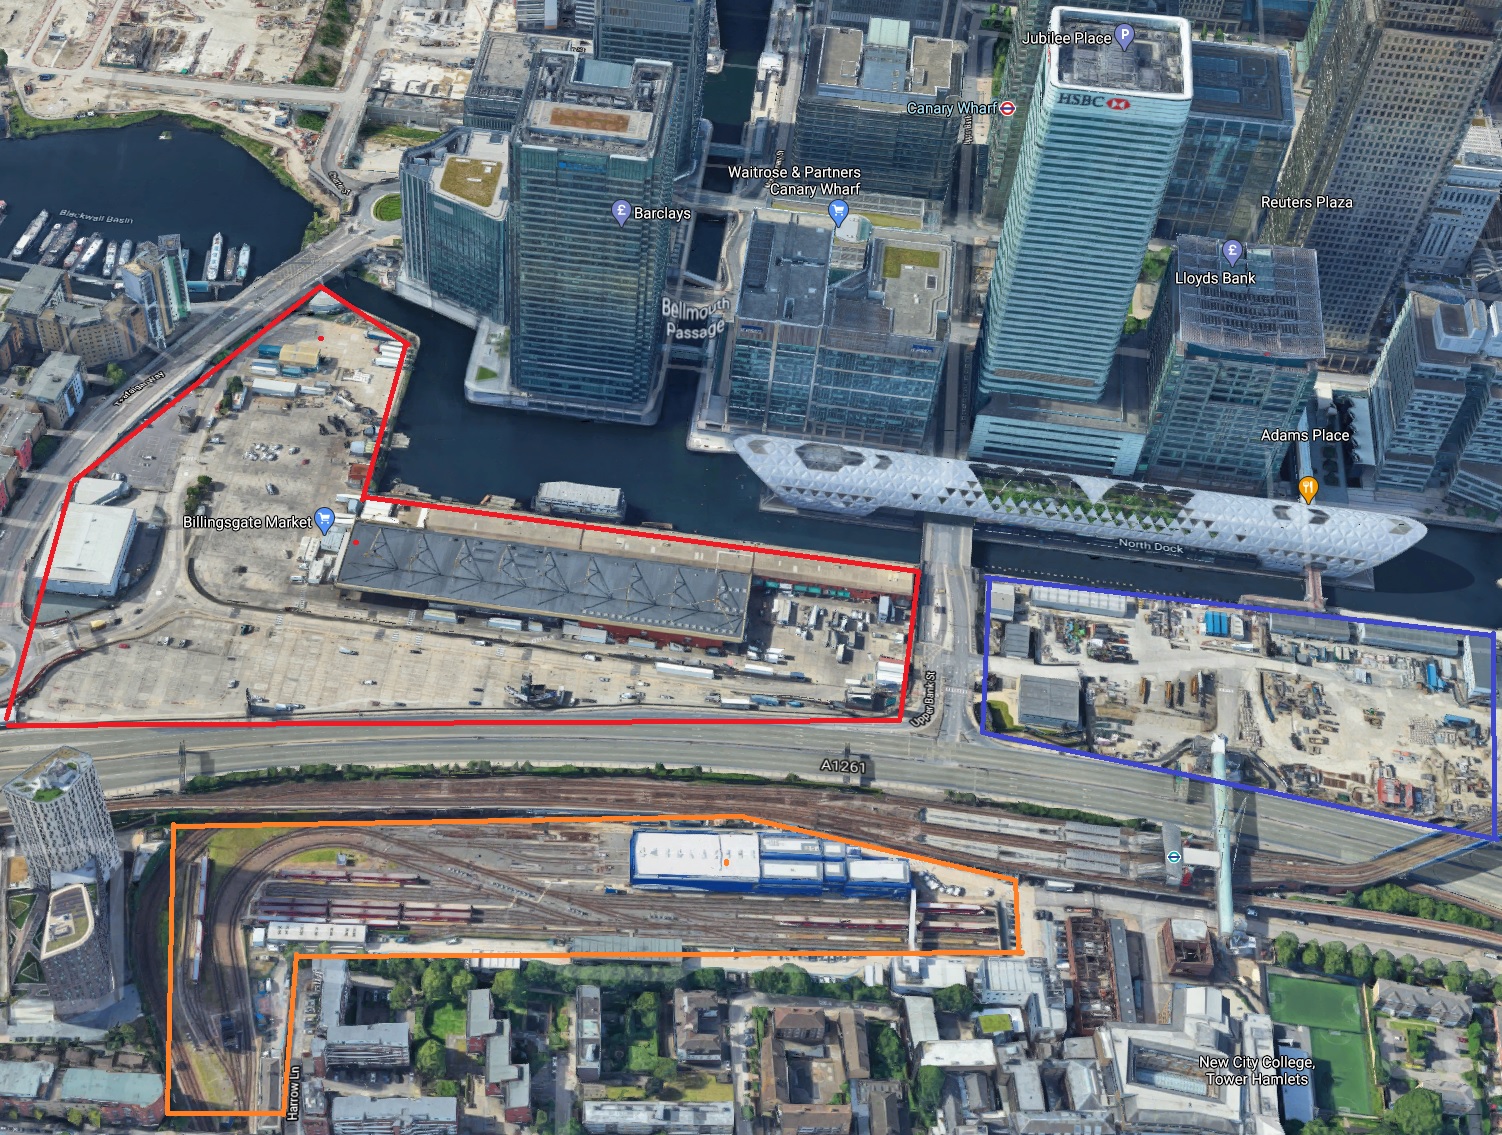
Canary Wharf on the Elizabeth line is somewhat away from many homes and offices, and is still awaiting vast developments nearby such as North Quay and redevelopment of Billingsgate market which is set to move to Barking.
There are always tentative plans to build over the DLR depot retaining siding below, and improving the link between Poplar station and Canary Wharf Elizabeth line station.
Other stations not even plugged into the core tunnels yet are also worth a look. It’s not that long ago that West Ealing had no Sunday services whatsoever with limited evening services. Now it’s at 214,039 passenger journeys in a month. Acton and Hanwell are some way behind but have also seen improved frequencies which will attract greater usage.

Over in the east and back on the core route, Custom House was the very first station I tapped in on opening day – and it saw 314,846 journeys in a month of which about eight ended up being by me.

Taking these numbers with an enormous barrel of salt, if we multiply the Custom House total by 12 months it may end up near four million journeys. If it does end up there that be someway above the 2.2m pre-pandemic figure when only the DLR on the Beckton branch called. During the pandemic it sunk to 0.8m users. More major events are now back on at the adjacent Excel.
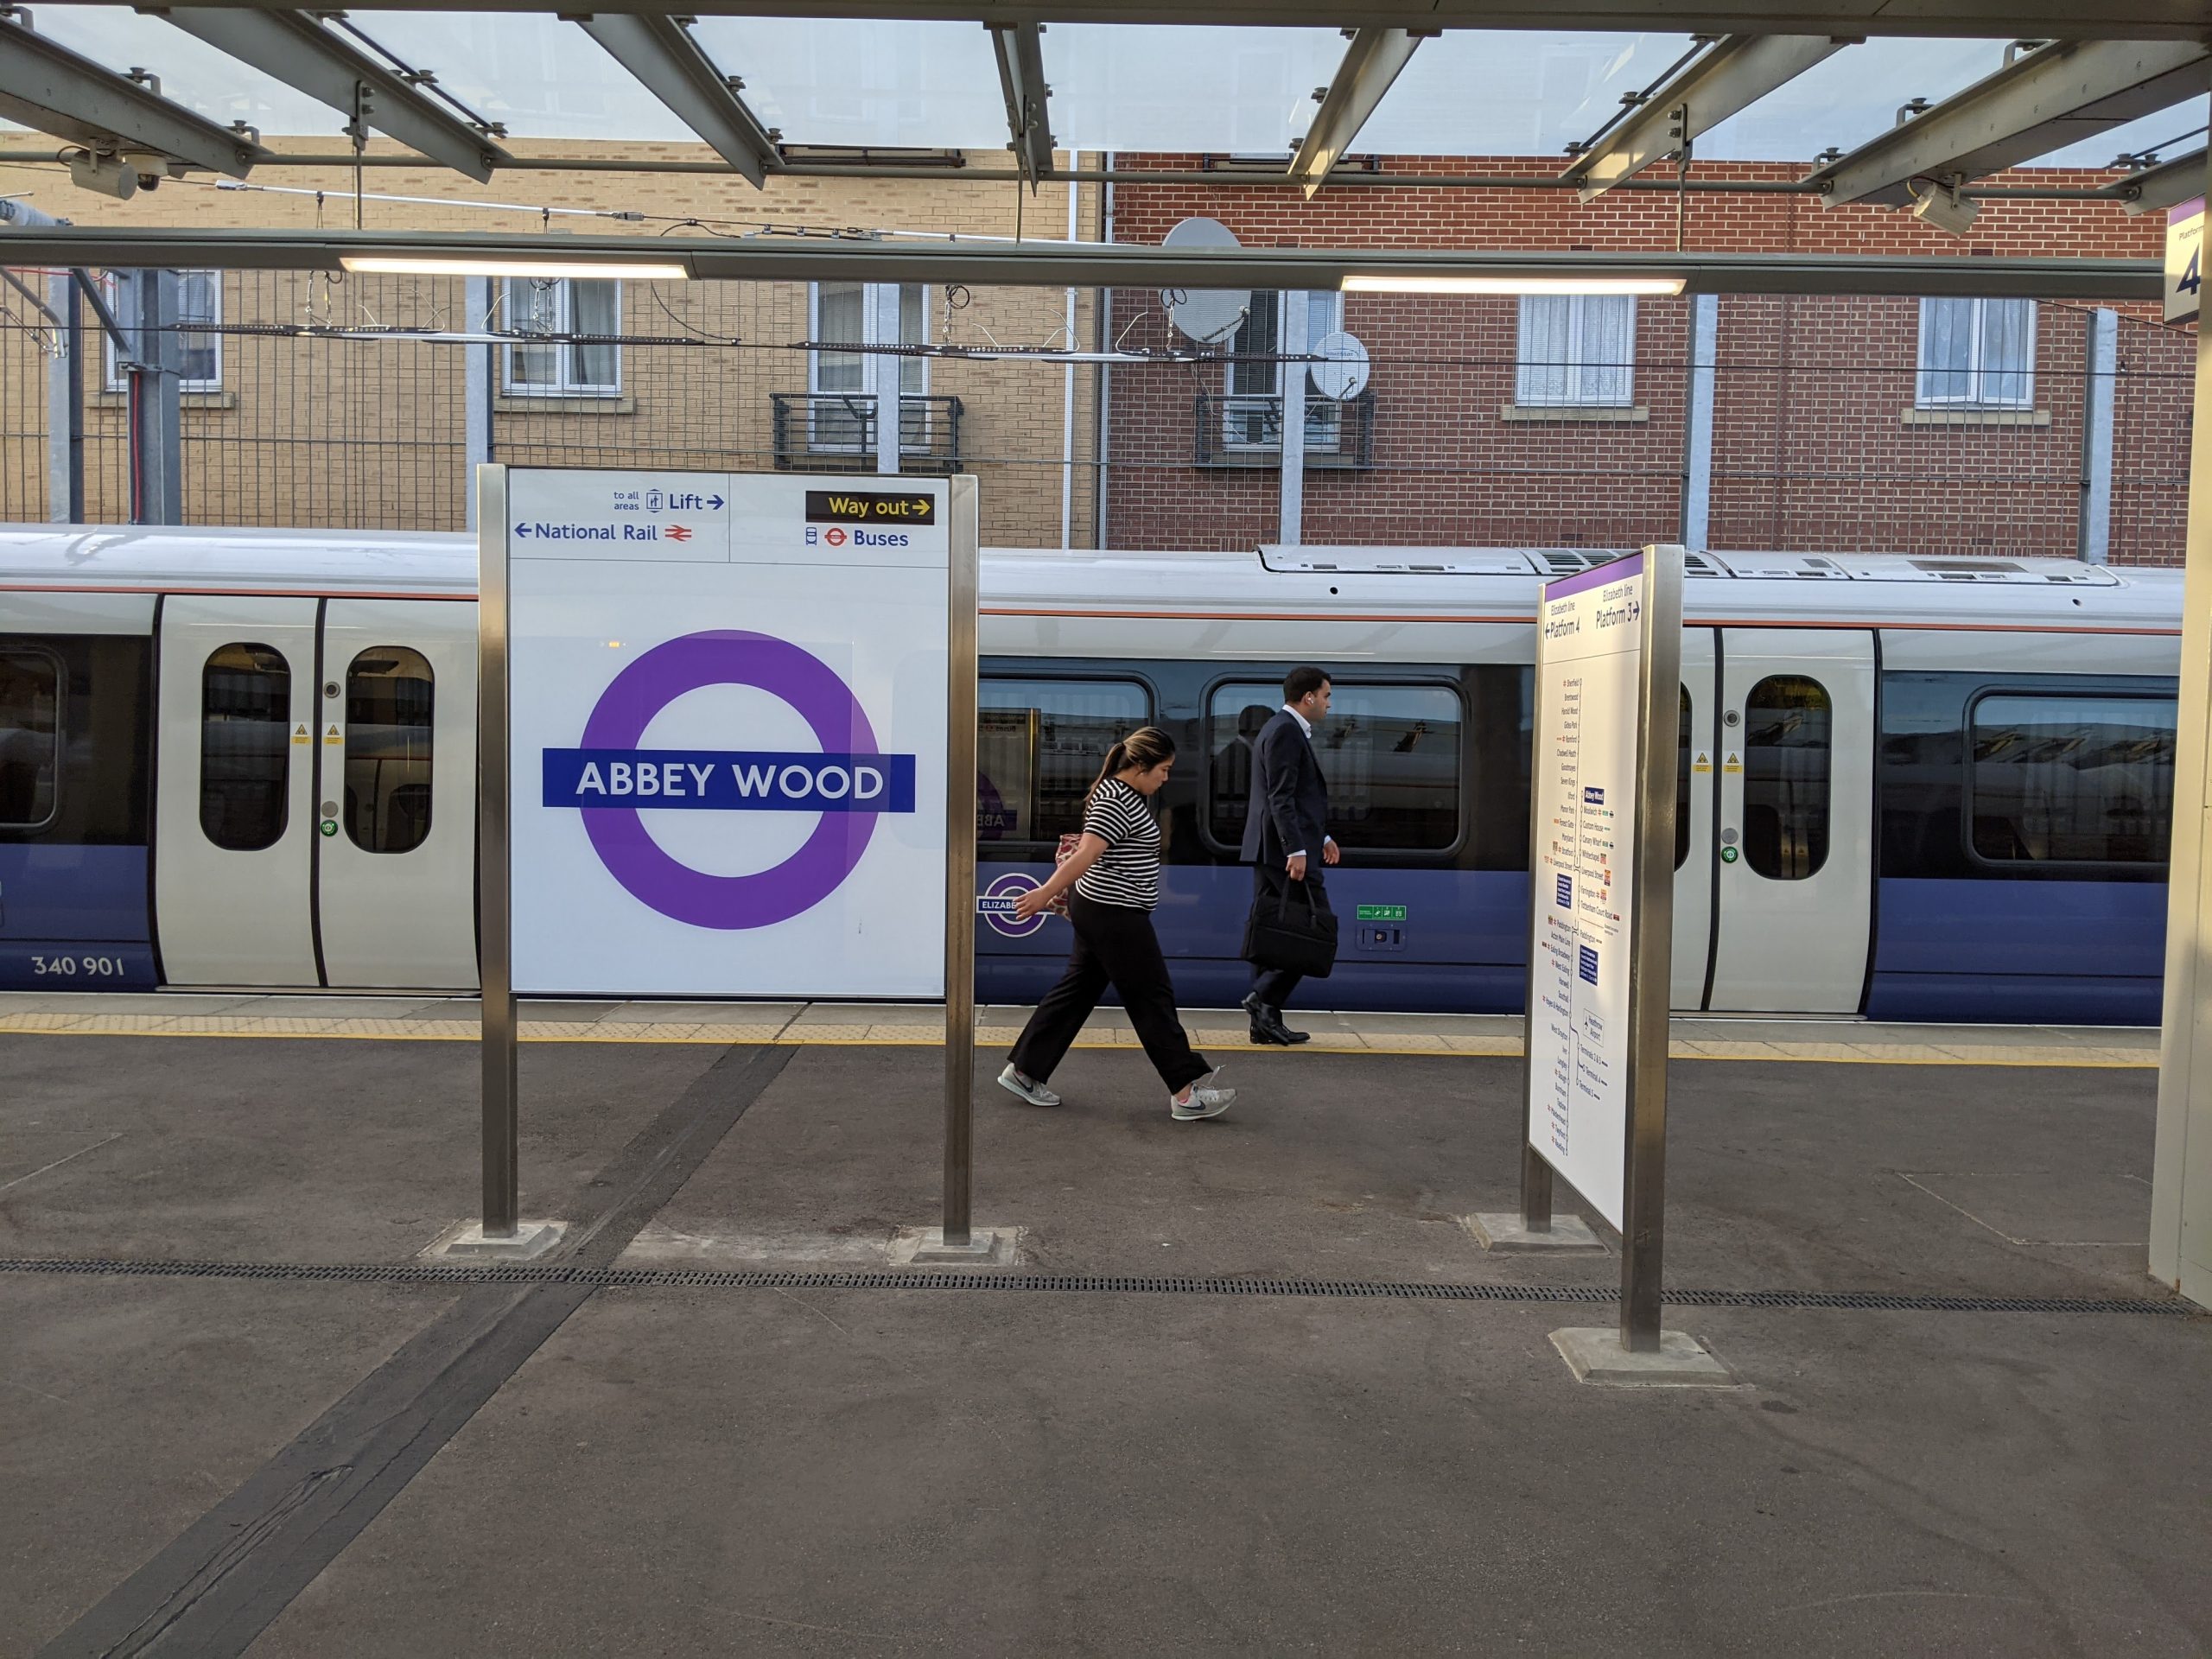
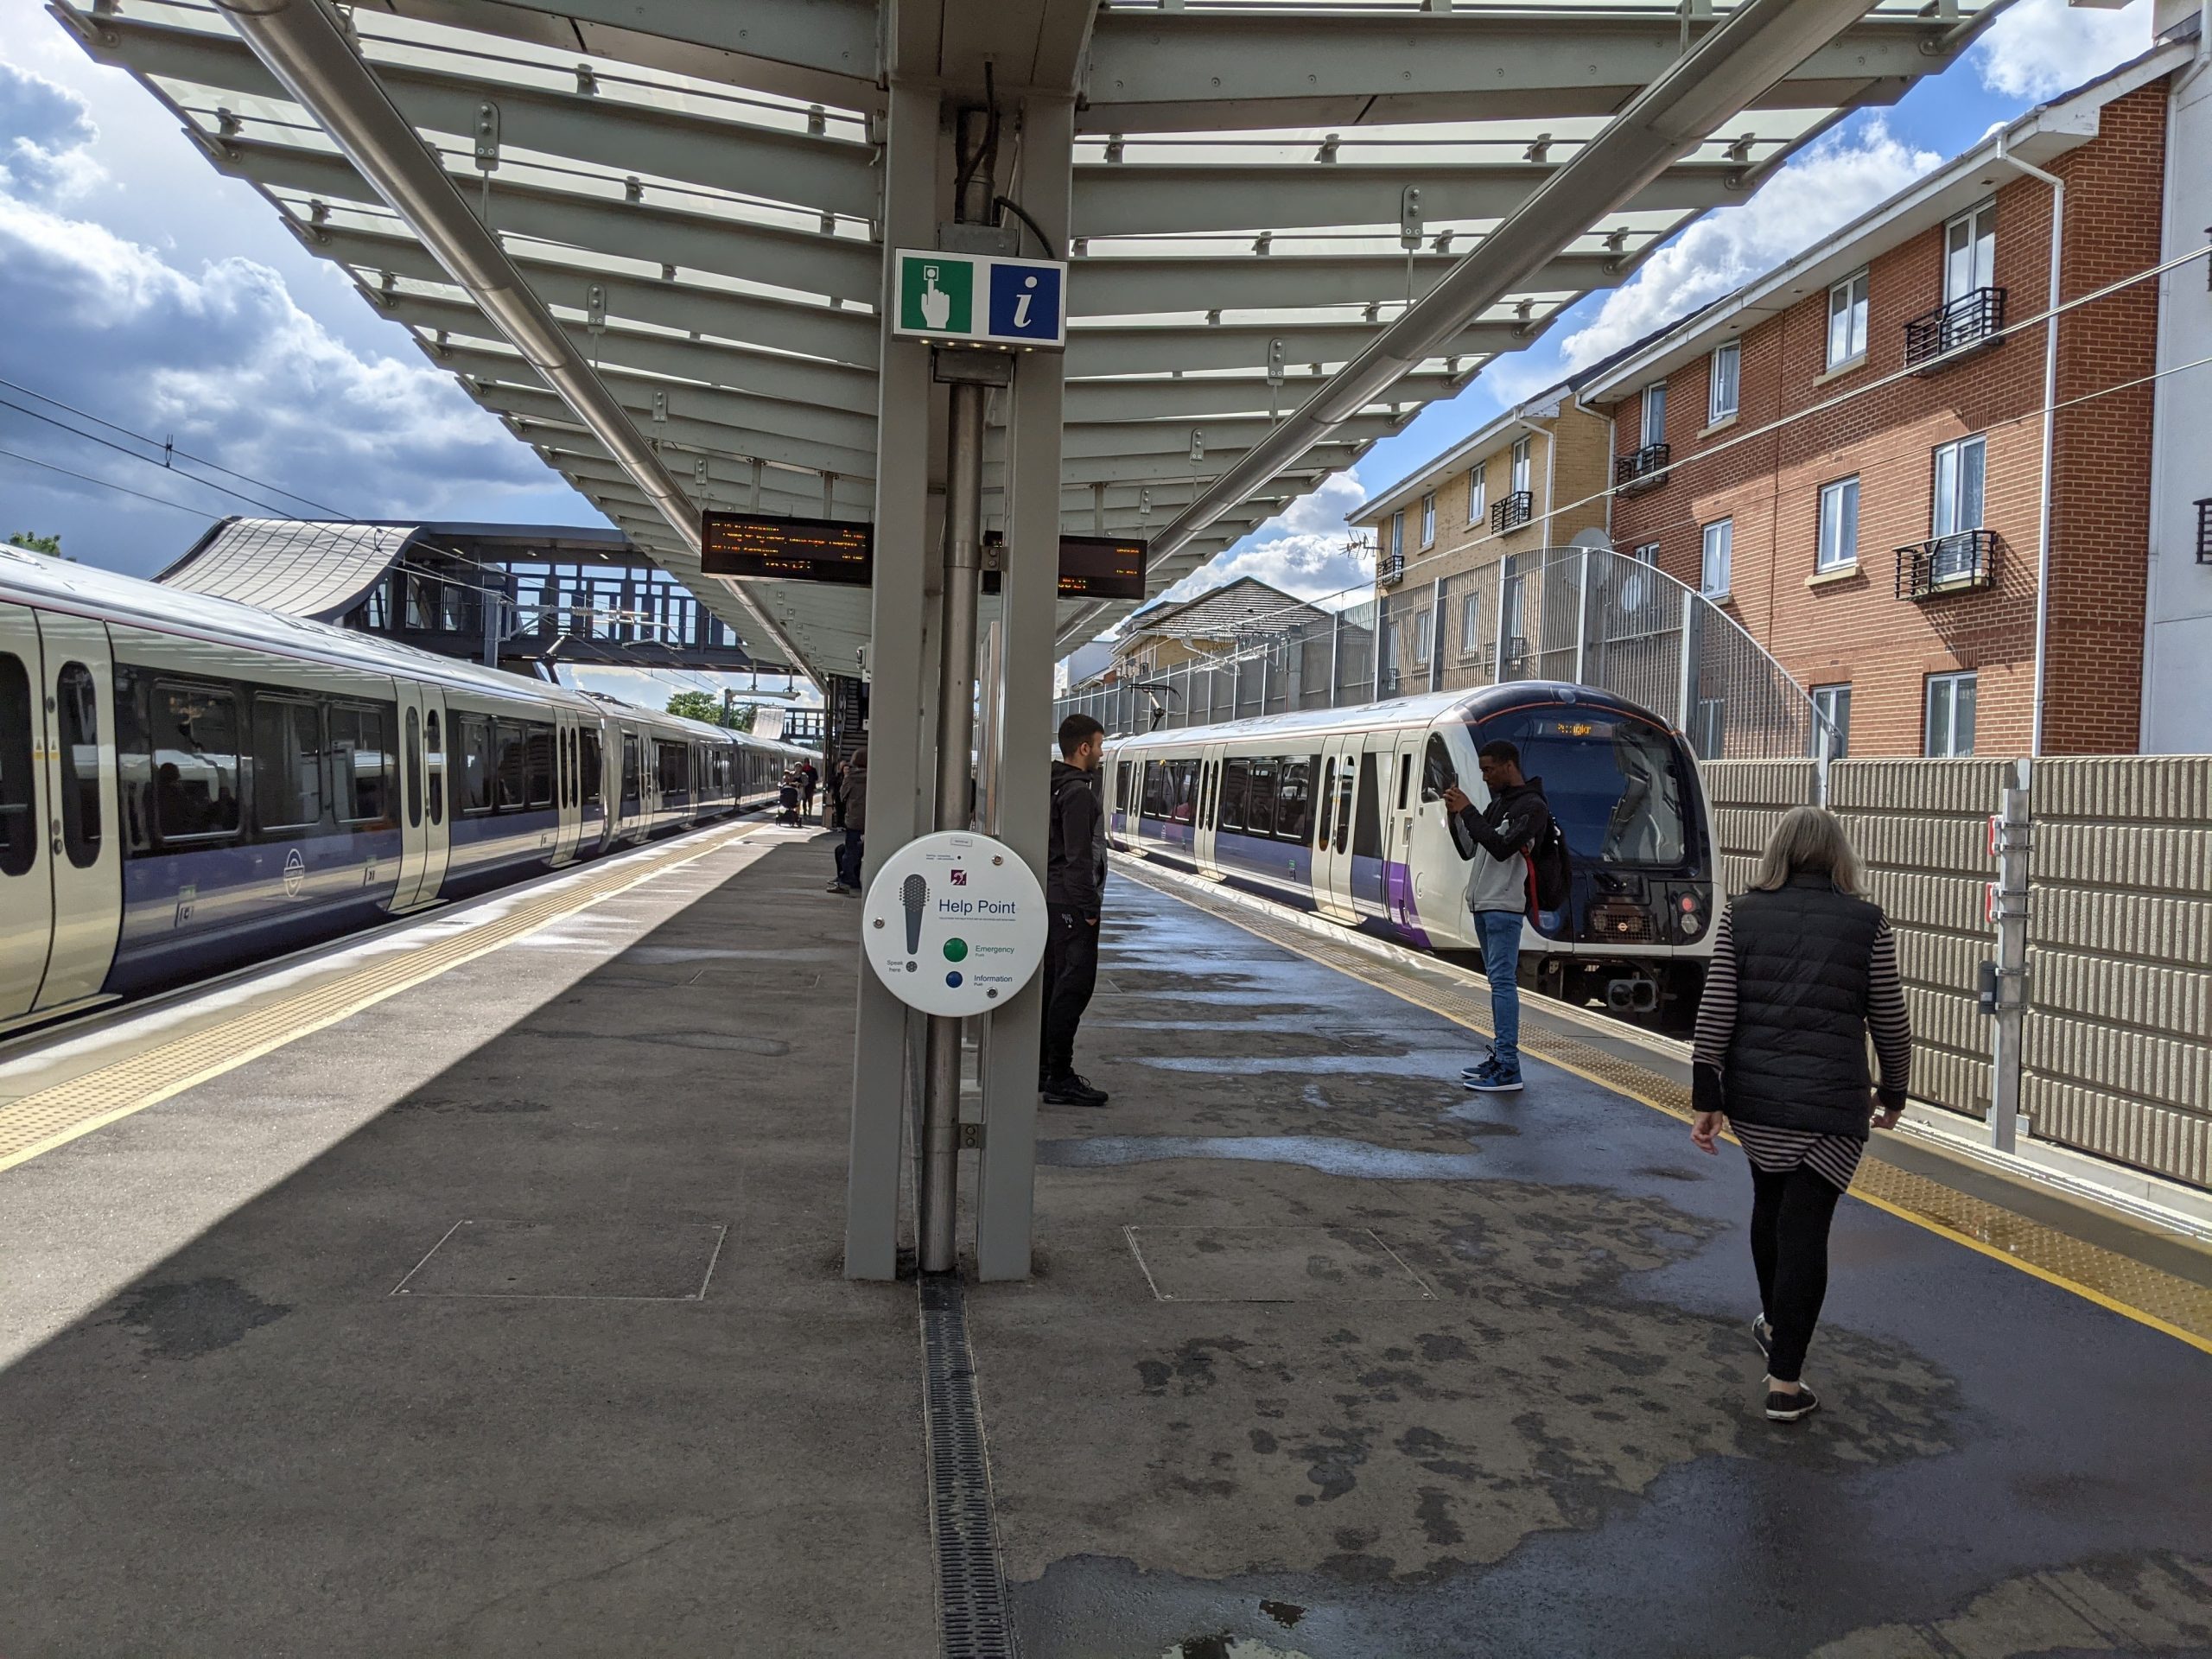
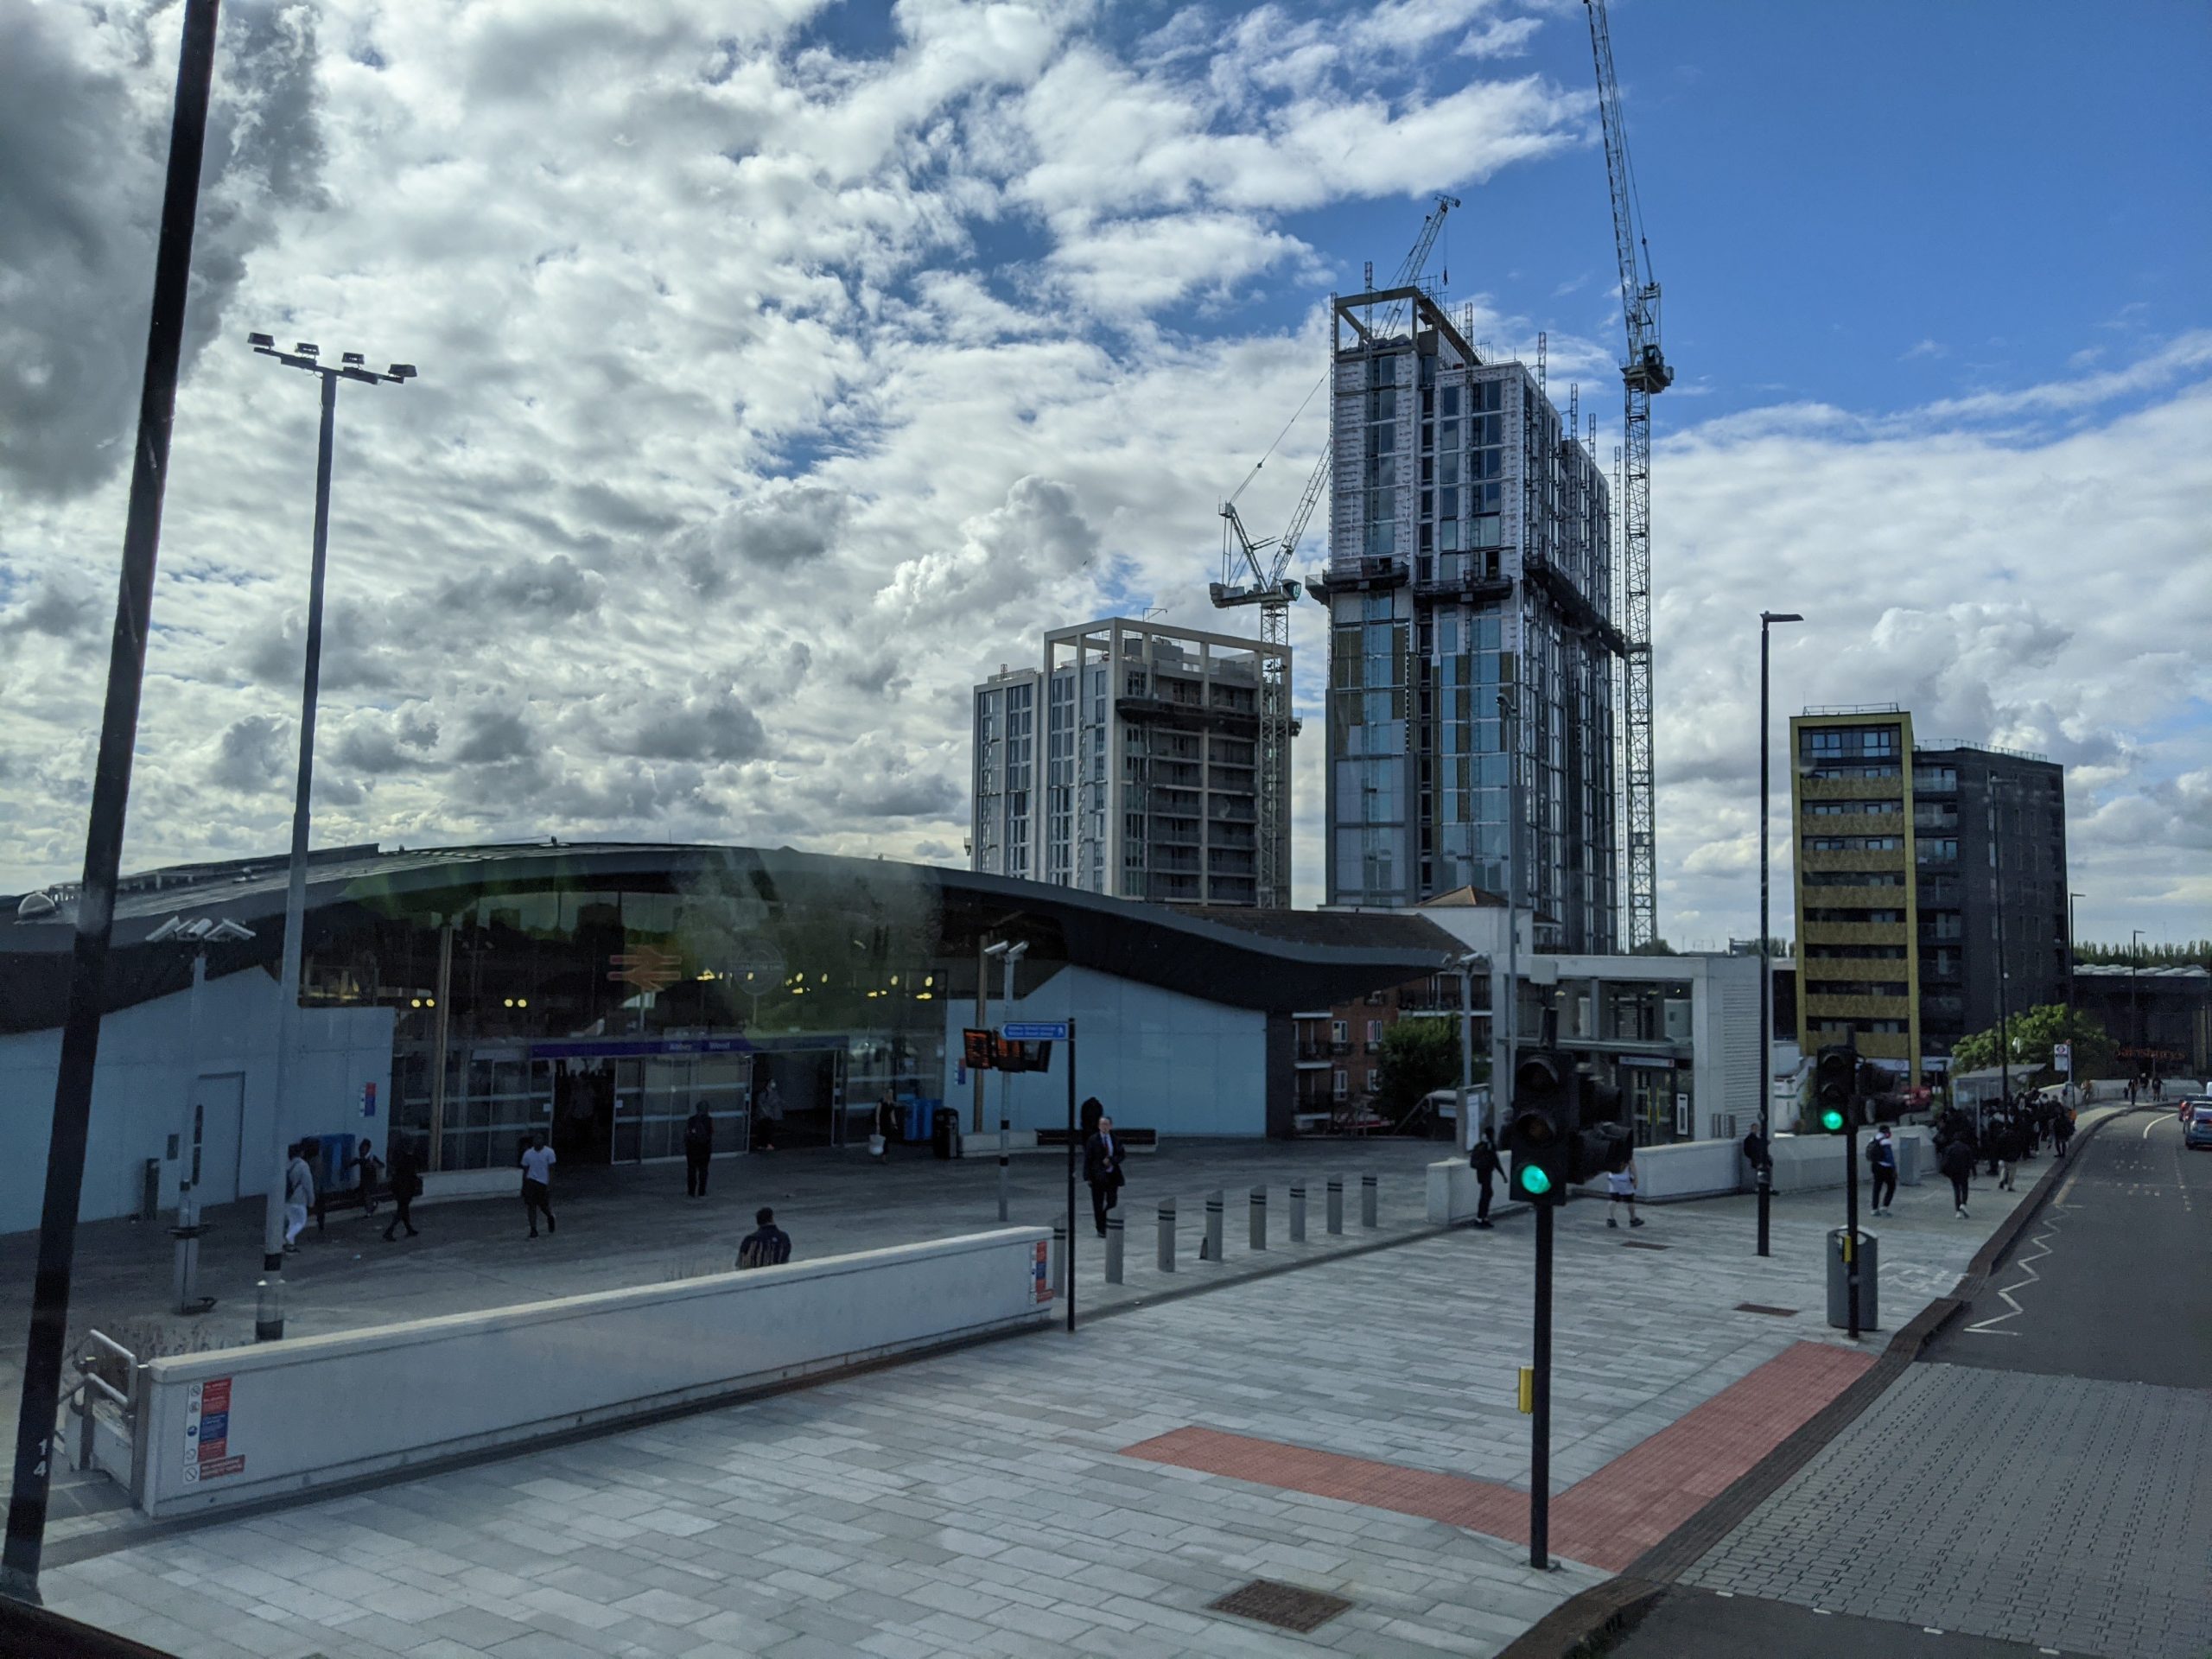
Abbey Wood’s total at 416,866 seems impressive not only compared to previous usage but also compared to Woolwich and Canary Wharf, though of course the station does also serve Southeastern and Thameslink.
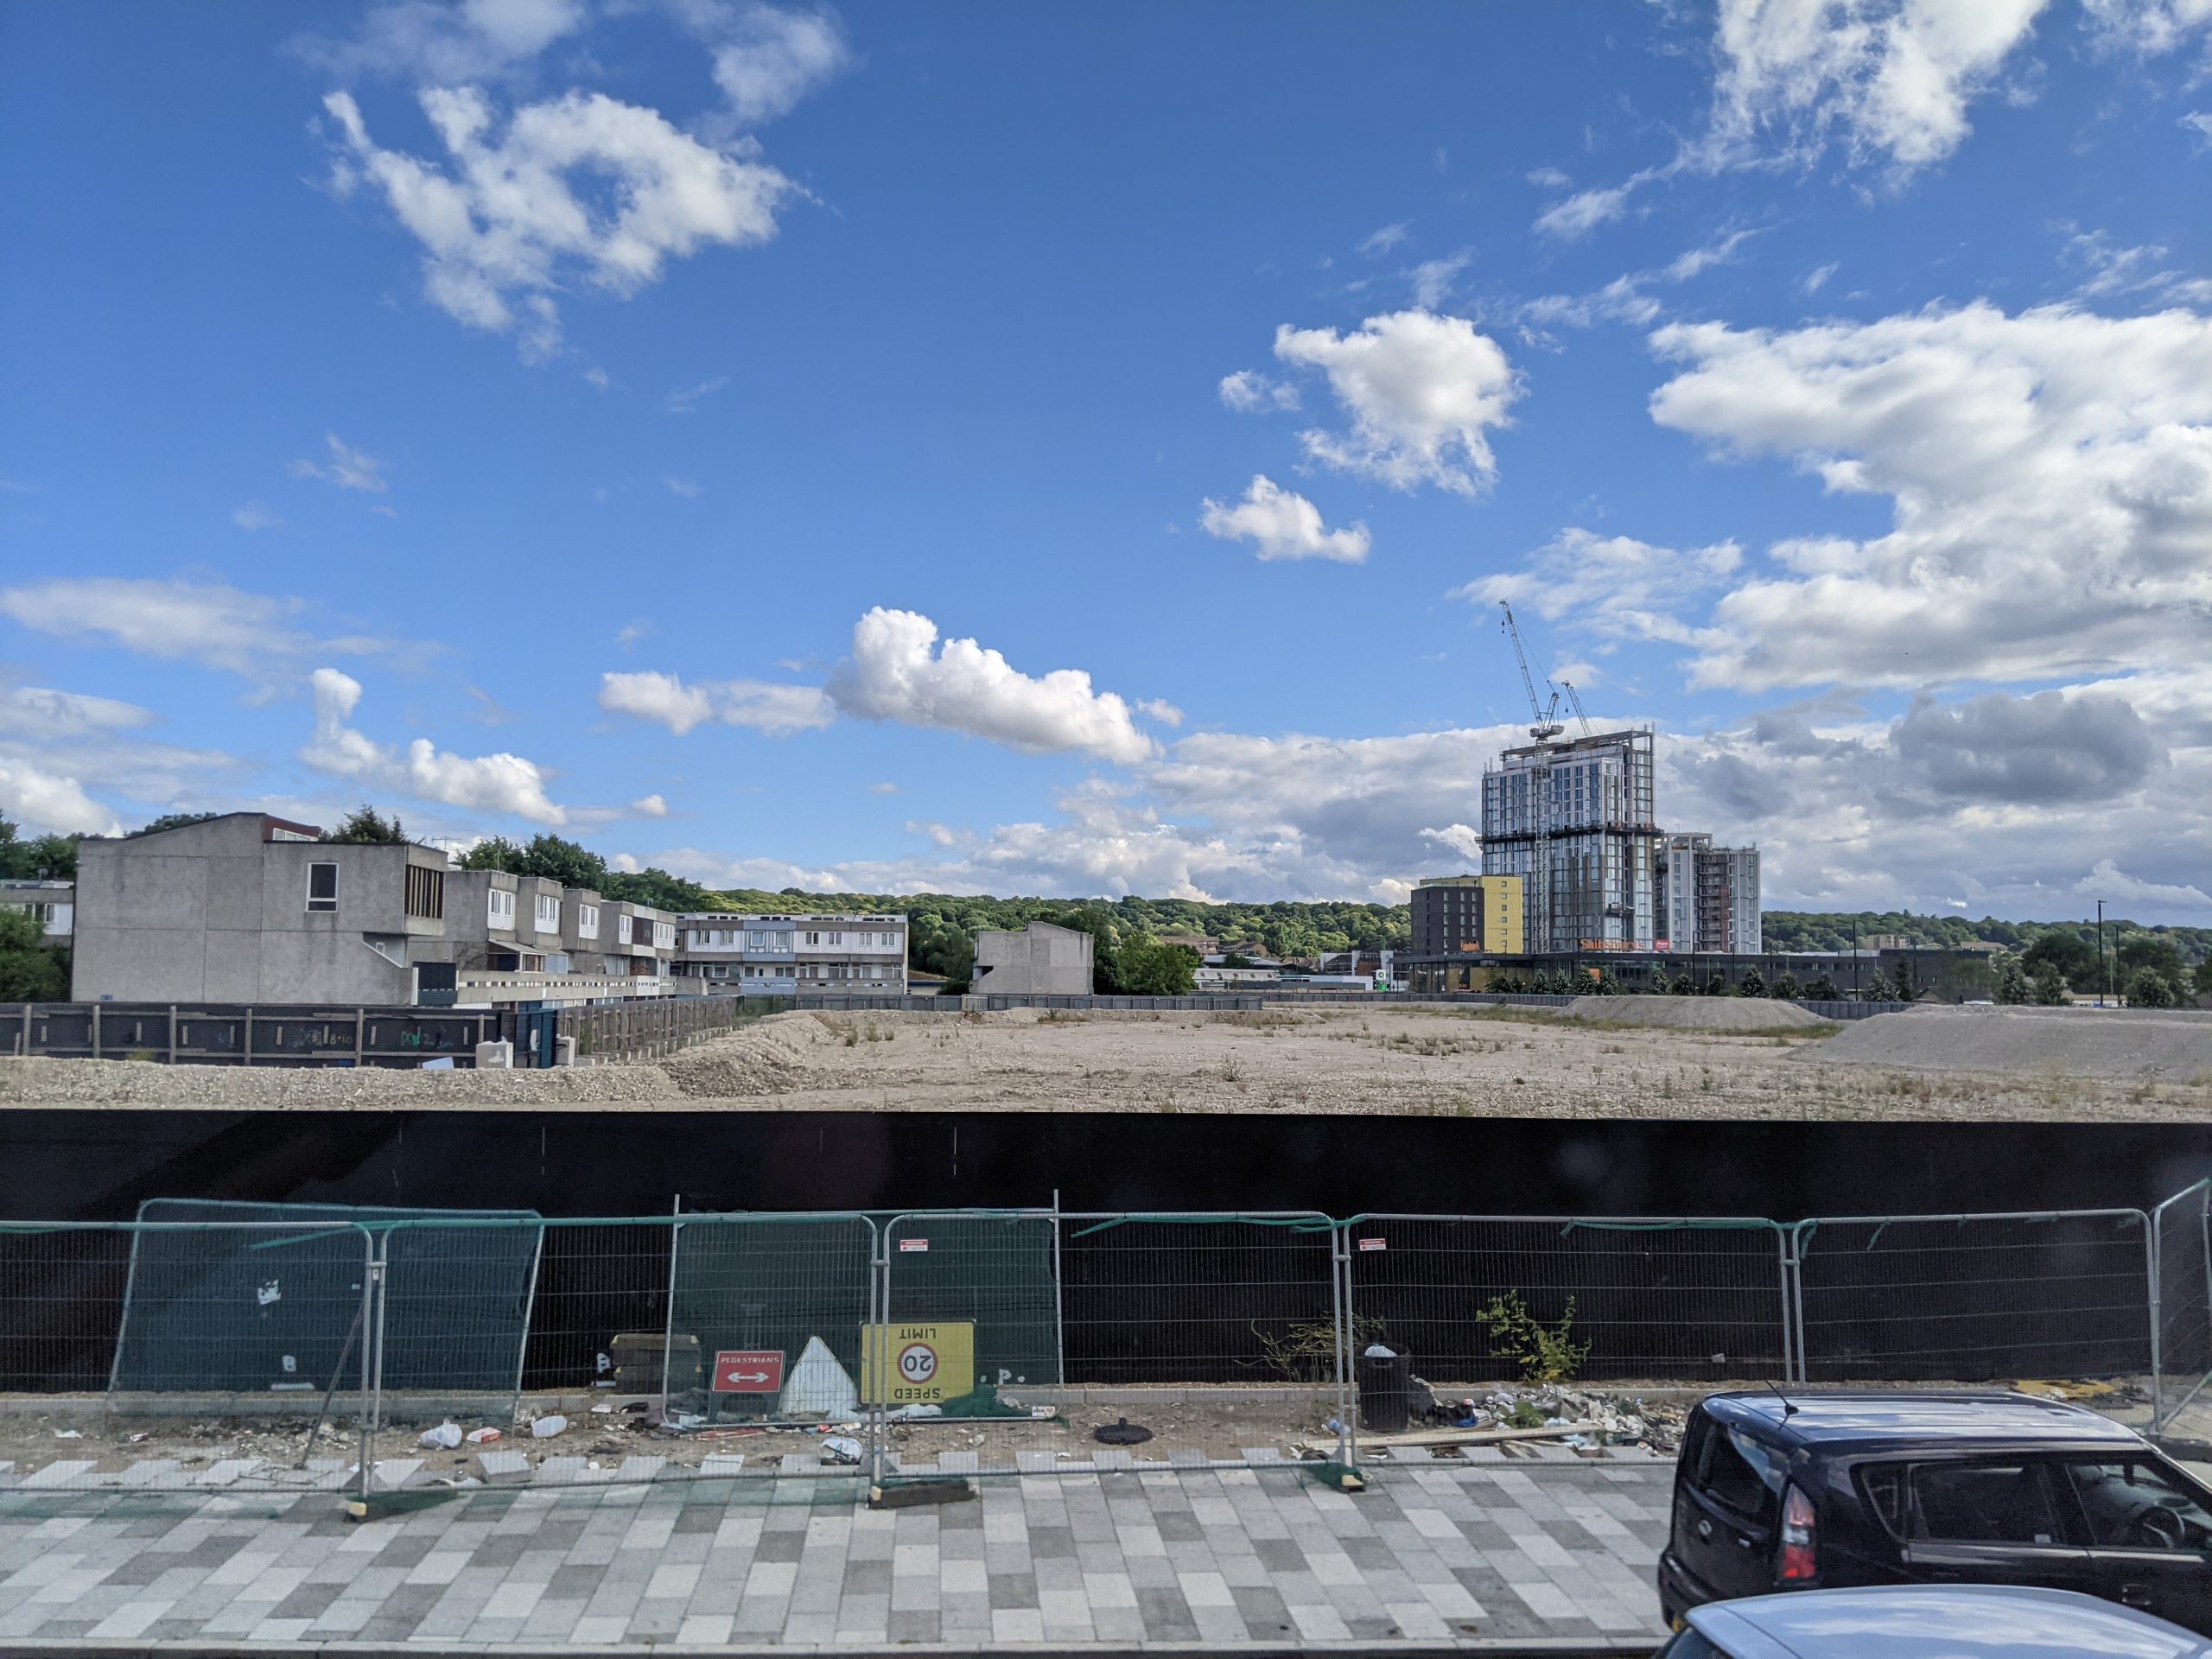
Yet the local area has though seen many homes demolished in recent years so could well be one of the few stations with a declining local population as Peabody slowly embark on rebuilding much of Thamesmead.
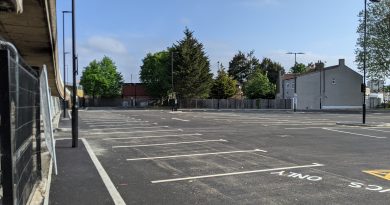
Abbey Wood being the first station does of course attract people driving from further out, and locals have complained about parking since opening.
Greenwich Council did consult on expanded parking controls in 2017, but still havn’t introduced them.
Like many stations the new link has acted as a trigger for new homes, and non-Peabody sites have appeared to move quicker.
The big question now – as raised in yesterdays’ post looking at Woolwich, is whether modal shift occurs from other TfL rail lines and Southeastern, or whether the line will also draw people from cars or buses.
There’s no doubt new housing along the route will bring with it a passenger boost as you can’t walk two minutes from most without major plans either underway or coming along.
Now for the figures in month two.
Running a site alone takes time and a fair bit of money. Adverts are far from enough to cover it and my living costs as a private renter.
You can support me including via Paypal here Another option is via Patreon by clicking here You can also buy me a beer/coffee at Ko-fi here There's also a Facebook page for the site here Many thanks
It would be good to see how the numbers compare with the previous month (the month leading up to Crossrail opening). That might give a sense of how many additional entries/exits are due to the Elizabeth line opening.
I have seen the EL usage grow week on week. The train strikes and the hot weather have also pushed up usage. I’m sure many people only tried the EL because of that and then they became converts.